Lucid
Value Stream Map Template
Published: April 2, 2026
Video Description
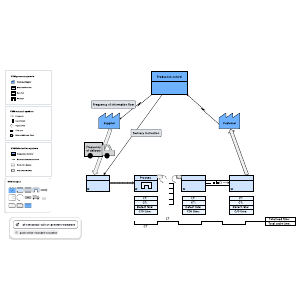
Learn how to use value stream mapping in Lucidchart to identify waste and maximize efficiency. This tutorial covers standard symbols like process boxes and inventory triangles, while explaining the vital differences between lead time and cycle time. We'll show you how to map material and information flows to move your process toward a lean future state.
Learn more about Lucidchart and sign up for a free account today:
https://www.lucidchart.com
*Timestamps*
0:00 What is value stream mapping?
0:22 How value stream mapping optimizes processes
0:33 Standard symbols and notation
0:55 Current state vs. future state
1:06 Essential data calculations and metrics
1:27 Information flow vs. material flow
1:38 Identifying waste and using sticky notes
1:49 Step-by-step tutorial in Lucidchart
2:11 Drawing flows and using the timeline tool
*Recommended resources*
[Guide] What is value stream mapping?
https://www.lucidchart.com/pages/value-stream-mapping
[Template] Value stream map example:
https://lucid.co/templates/value-stream-map
[Training] Basics in Lucidchart course:
https://training.lucid.co/basics-in-lucidchart
#ValueStreamMapping #Lucidchart #LeanManufacturing #WorkflowOptimization #ProcessImprovement
*About Lucid*
Lucid Software is the leader in visual collaboration and work acceleration, helping teams turn ideas into reality. Its Visual Collaboration Suite (Lucidchart and Lucidspark) and airfocus, an AI-powered product management platform, help organizations streamline work, foster alignment, and drive business transformation. The most used work acceleration platform by the Fortune 500, Lucid is trusted by 100M+ users worldwide.
🔔 Subscribe for more tips and tutorials: https://www.youtube.com/@lucid_software?sub_confirmation=1
*Connect with us*
Facebook: https://www.facebook.com/lucidsoftware
Twitter: https://x.com/lucidsoftware
Instagram: https://www.instagram.com/lucidsoftware/#
LinkedIn: https://www.linkedin.com/company/lucidsoftware/